
Dashboard
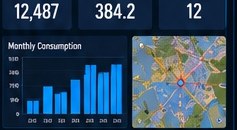
- District-wide KPI cards
- Water-use trend
- GIS / system map
- Recent alerts
- Conservation status
- Quick actions
What if your utility's data actually worked together?
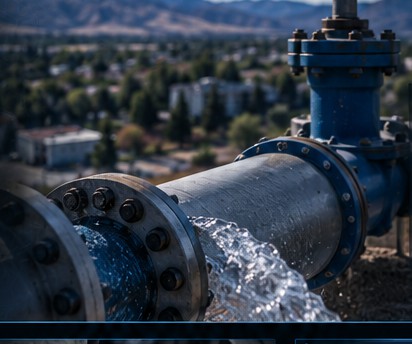
A unified platform that brings together customer, meter, property, consumption, GIS, conservation, alerts, and reporting — so a water agency can see its whole operation in one place and act on it.
Water agencies run on data that usually lives in separate places — billing, meters, GIS, spreadsheets, and field notes that rarely talk to each other. This project demonstrates what happens when that data is connected: staff can look up a property, see its meter and usage history, spot a possible leak, view it on the map, and open a work order — all in one flow.
It's built to look and behave like a realistic utility application, using a fictional agency — Clearview Water District — and entirely synthetic data. No employer, customer, or production data is used.
The core demonstration follows one complete path — the everyday job of answering "what's going on with this account?"
Example built into the demo data: a meter whose normal use is ~450 gallons/day suddenly reading ~1,900 gallons/day — automatically flagged as a possible continuous leak, ready for a work order.

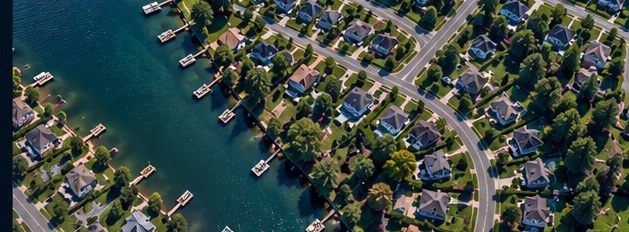
The same kind of integration Mad Man Data builds for clients: validated data, a Python ETL pipeline into PostgreSQL and PostGIS, with analytics and GIS feeding a single API that powers the dashboard, maps, and reports.